June 16:
One of the Shale Gas Revolution's paradoxes is the
market's remarkably weak ability - in retrospect - to anticipate the
natural gas industry's macro trends and properly price them into the
commodity's futures curve.
It almost appears that for an extended period of time investors were reluctant to admit that the shale revolution had actually occurred.
The futures curves seemed to imply a bet that the industry's dramatically expanded resource base and improved cost structure were not sustainable in the long run.
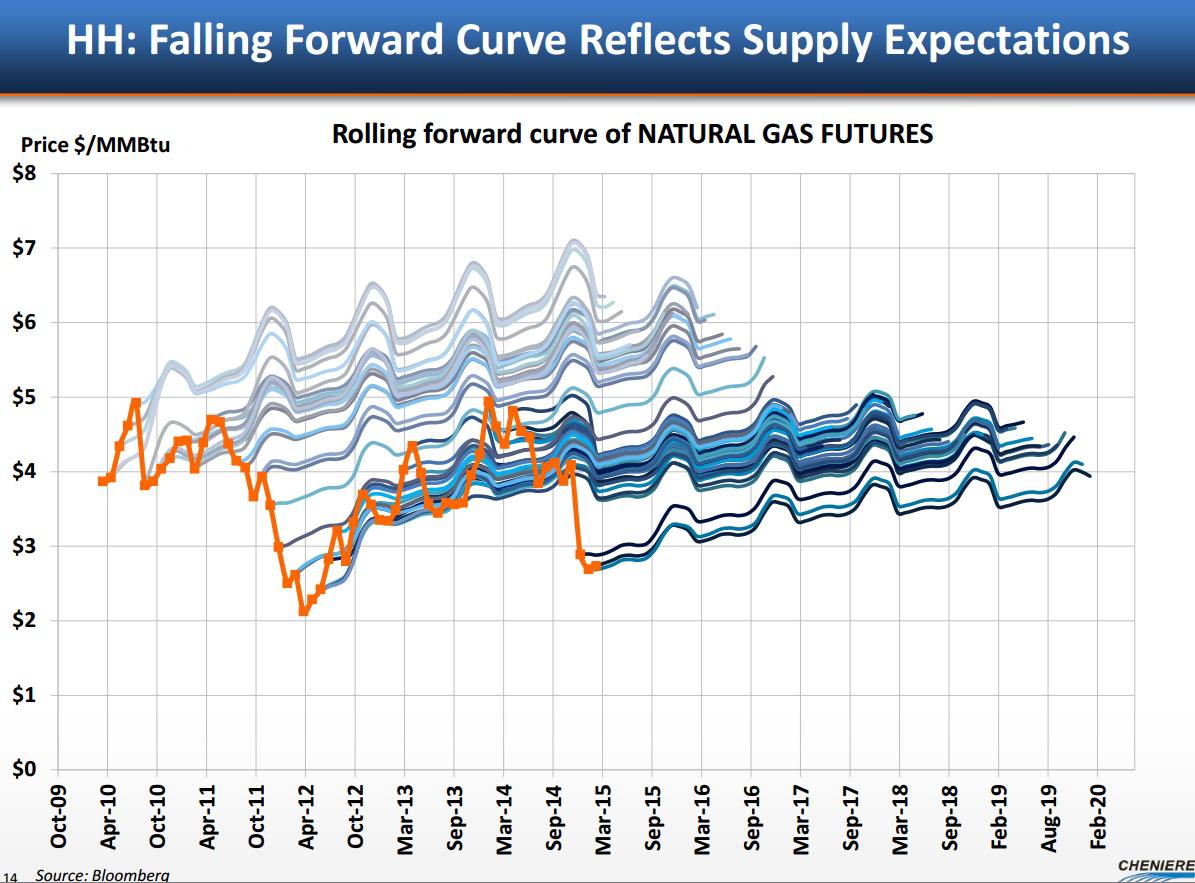
The graph shows, for each specific point in time, the shape of the Nymex natural gas futures strip (Henry Hub).
The graph depicts a very consistent tendency by the market to price into the futures curve what appears to be the expectation of a "mean reversion" to a higher price level. It almost appears that the market was projecting a rear view mirror image of natural gas fundamentals onto the future.
(click to enlarge)
(Source: Cheniere Energy, April 2015)
By looking at this graph more closely, one can see how at the end of 2009, when the U.S. economy started to recover from the worst part of the financial crisis, the five-year strip was reflecting an expectation of natural gas price return to levels above $6 per MMBtu within five years.
The natural gas price crisis of 2012 vividly demonstrated that the pace of natural gas production growth in the U.S. was far greater than anyone could have predicted. The front end of the futures curve dropped below $2/MMBtu, causing an enormous pain for natural gas producers. In response, the five-year-forward price of natural gas dropped just below $5/MMBtu and then continued to trade in the ~$4.50/MMBtu range for another two years.
Looking at the most recent futures curve, one can see that the market has come a long way in its understanding of the change that has occurred in the commodity's cost of supply. The shape of the futures curve is no longer as steep as it used to be over the past several years. A flatter curve (particularly after adjusting for inflation) may indicate that the market does not perceive the current low price to be a transitory singularity but rather a reflection of a fundamental shift in the industry's asset base and cost structure.
(click to enlarge)
It is quite remarkable that the forward 12-month average price of natural gas remains below $3.50 per MMBtu for another four years, until approximately April 2019, and below $4.00 per MMBtu for another eight years, until approximately April 2023. Taking inflation into account, the futures curve is effectively implying that the U.S. natural gas is a $3.50 per MMBtu commodity.
Has the pendulum swung too far? Is it possible that the same way the market misjudged the sustained nature of the industry's productivity gains it is now failing to anticipate an inflection point in the price of natural gas?
In this regard, reports by natural gas producers with regard to their cost of supply may provide some helpful insights.
Rice Energy (NYSE:RICE), a mid-size operator in the Marcellus/Utica area, estimates its drilling returns at ~24% in the Marcellus and ~32% in dry gas Utica assuming a flat Nymex price of $3.00 per MMBtu. At $4.00 per MMBtu, these returns exceed 80%.
(click to enlarge)
(Source: Rice Energy, June 2015)
Rice's peer operator in the Marcellus/Utica area Antero Resources (NYSE:AR) shows comparable returns at low gas prices. Antero expects to generate well-level IRRs on drilling in its highly-rich-gas and condensate acreage in the Marcellus in the 20%-30% range at a flat price of $3.00 per MMBtu.
(click to enlarge)
(Source: Antero Resources, June 2015)
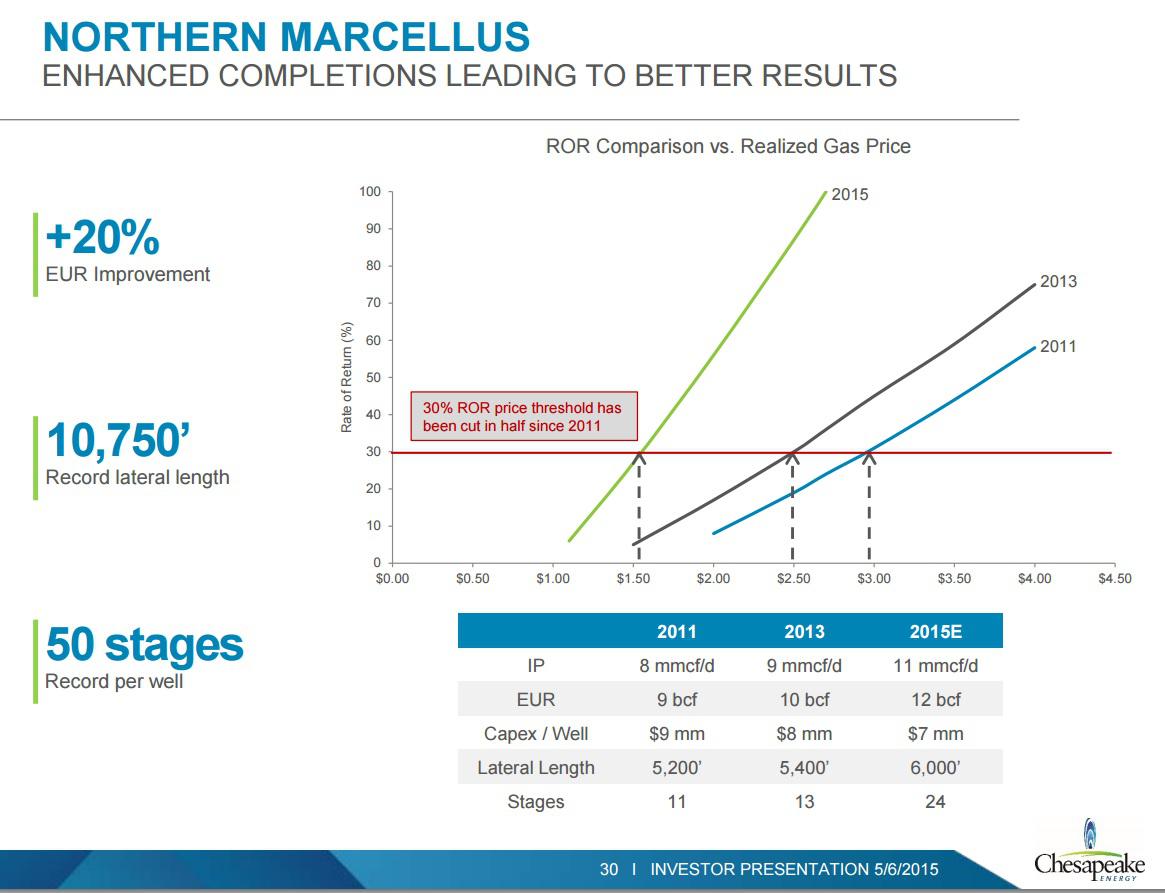
Chesapeake Energy (NYSE:CHK) has indicated that its 2015 drilling program in the Marcellus North is generating threshold drilling returns of 30% at a realized price for natural gas as low as $1.50 per Mcf. Assuming that the differential to Nymex in the Marcellus North will decline to ~$1.00 per Mcf in the medium term, one would conclude that Chesapeake's drilling economics in the area should be compelling at Nymex prices above ~$2.60 per MMBtu (including the heat content factor).
(click to enlarge)
(Source: Chesapeake Energy, June 2015)
The Marcellus and Utica are not the only areas where operators are reporting competitive IRRs at relatively low natural gas prices. The Haynesville is an example of a Tier 2 shale where the transfer of technical lessons from oil shales is redefining drilling economics. The following slide shows return estimates by EXCO Resources (NYSE:XCO) for the company's drilling program in the play. As one can see, EXCO anticipates to generate returns in a 20% range at a flat Nymex price of $3.00 per MMBtu assuming the company can reduce its completed well costs by an additional 10%. Given that the estimate was prepared in March, such a cost improvement does not appear unrealistic in light of the industry's most recent service cost dynamics.
(click to enlarge)
(Source: EXCO Resources, March 2015)
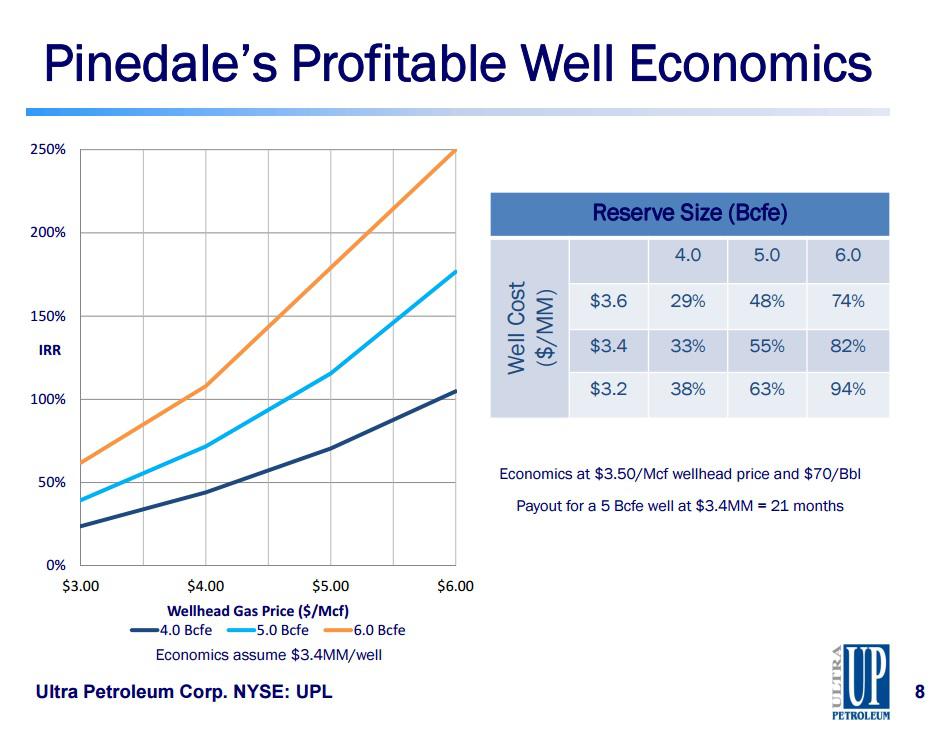
In a similar fashion, Ultra Petroleum (NYSE:UPL), the leading operator in Pinedale Anticline, indicates that it can earn attractive returns at natural gas prices as low as $3.00 per Mcf at the wellhead (which in Ultra's case is comparable to the Nymex price per MMBtu).
(click to enlarge)
(Source: Ultra Petroleum, June 2015)
The above examples show quite clearly that $3.50 per MMBtu should not be ruled out as a potentially sustainable price for natural gas in the near-to-medium term, based on the industry's current cost structure.
While the fixed component of the midstream cost will remain mostly sunk, the savings from supply chain price concessions are cyclical in nature and may disappear as industry-wide activity picks up.
There are multiple components that define the cost of marginal supply. Some of those components are likely to continue on a secular decline trajectory, while certain others - such as supply chain costs - are cyclical in nature.
Demand growth from LNG exports, gas-fired power generation, Mexico exports and petrochemical uses have the ability of moving the market clearance point materially higher. However, the demand factor will come into play in earnest only in three-four years from now.
For the first time in a long time, the shape of the Henry Hub futures curve appears logical. On an inflation-adjusted basis, it implies a price of natural gas in the $3.25-$3.50/MMBtu range for the foreseeable future.
However, cost of supply is a dynamic metric. A strong recovery in oil prices combined with pent up demand have the ability to move the price of natural gas by as much as $1 per MMBtu higher.
The fundamentals discussed in this note may be relevant to natural gas-focused ETFs, such as:
Source: http://seekingalpha.com/article/3262255-natural-gas-a-3_50-commodity
Summary
- How accurate is the natural gas futures market in predicting future gas prices?
- Is the current strip underestimating the probability of a price recovery?
- What are natural gas producers’ views?
It almost appears that for an extended period of time investors were reluctant to admit that the shale revolution had actually occurred.
The futures curves seemed to imply a bet that the industry's dramatically expanded resource base and improved cost structure were not sustainable in the long run.
The Futures Curve That Has Been "Behind The Curve"
The following graph from Cheniere Energy's (NYSEMKT:LNG) presentation illustrates how much behind the curve the financial market was over the last five years in its understanding of the fundamental change that was taking place in the industry.The graph shows, for each specific point in time, the shape of the Nymex natural gas futures strip (Henry Hub).
The graph depicts a very consistent tendency by the market to price into the futures curve what appears to be the expectation of a "mean reversion" to a higher price level. It almost appears that the market was projecting a rear view mirror image of natural gas fundamentals onto the future.
(click to enlarge)
(Source: Cheniere Energy, April 2015)
By looking at this graph more closely, one can see how at the end of 2009, when the U.S. economy started to recover from the worst part of the financial crisis, the five-year strip was reflecting an expectation of natural gas price return to levels above $6 per MMBtu within five years.
The natural gas price crisis of 2012 vividly demonstrated that the pace of natural gas production growth in the U.S. was far greater than anyone could have predicted. The front end of the futures curve dropped below $2/MMBtu, causing an enormous pain for natural gas producers. In response, the five-year-forward price of natural gas dropped just below $5/MMBtu and then continued to trade in the ~$4.50/MMBtu range for another two years.
Looking at the most recent futures curve, one can see that the market has come a long way in its understanding of the change that has occurred in the commodity's cost of supply. The shape of the futures curve is no longer as steep as it used to be over the past several years. A flatter curve (particularly after adjusting for inflation) may indicate that the market does not perceive the current low price to be a transitory singularity but rather a reflection of a fundamental shift in the industry's asset base and cost structure.
(click to enlarge)
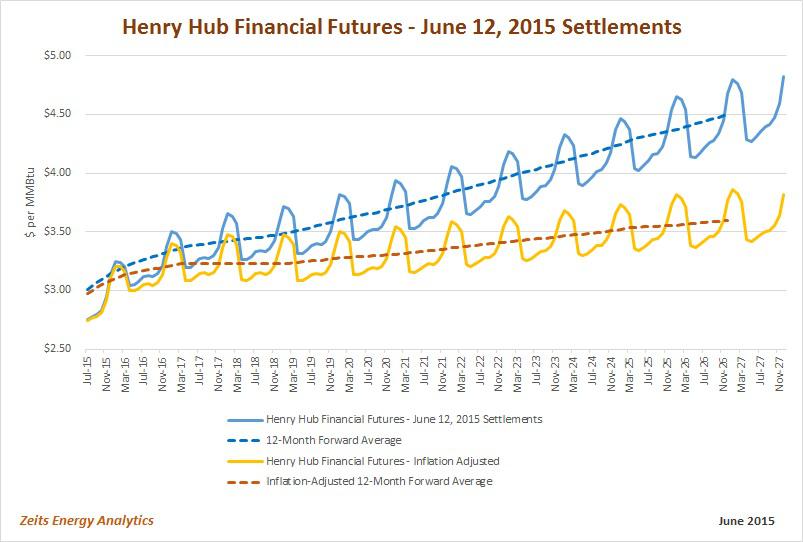
It is quite remarkable that the forward 12-month average price of natural gas remains below $3.50 per MMBtu for another four years, until approximately April 2019, and below $4.00 per MMBtu for another eight years, until approximately April 2023. Taking inflation into account, the futures curve is effectively implying that the U.S. natural gas is a $3.50 per MMBtu commodity.
Has the pendulum swung too far? Is it possible that the same way the market misjudged the sustained nature of the industry's productivity gains it is now failing to anticipate an inflection point in the price of natural gas?
In this regard, reports by natural gas producers with regard to their cost of supply may provide some helpful insights.
What Do Operators Say About Their Supply Cost?
In this note, I will provide select anecdotal examples of operator drilling return estimates, leaving a more detailed discussion for a separate article.Rice Energy (NYSE:RICE), a mid-size operator in the Marcellus/Utica area, estimates its drilling returns at ~24% in the Marcellus and ~32% in dry gas Utica assuming a flat Nymex price of $3.00 per MMBtu. At $4.00 per MMBtu, these returns exceed 80%.
(click to enlarge)
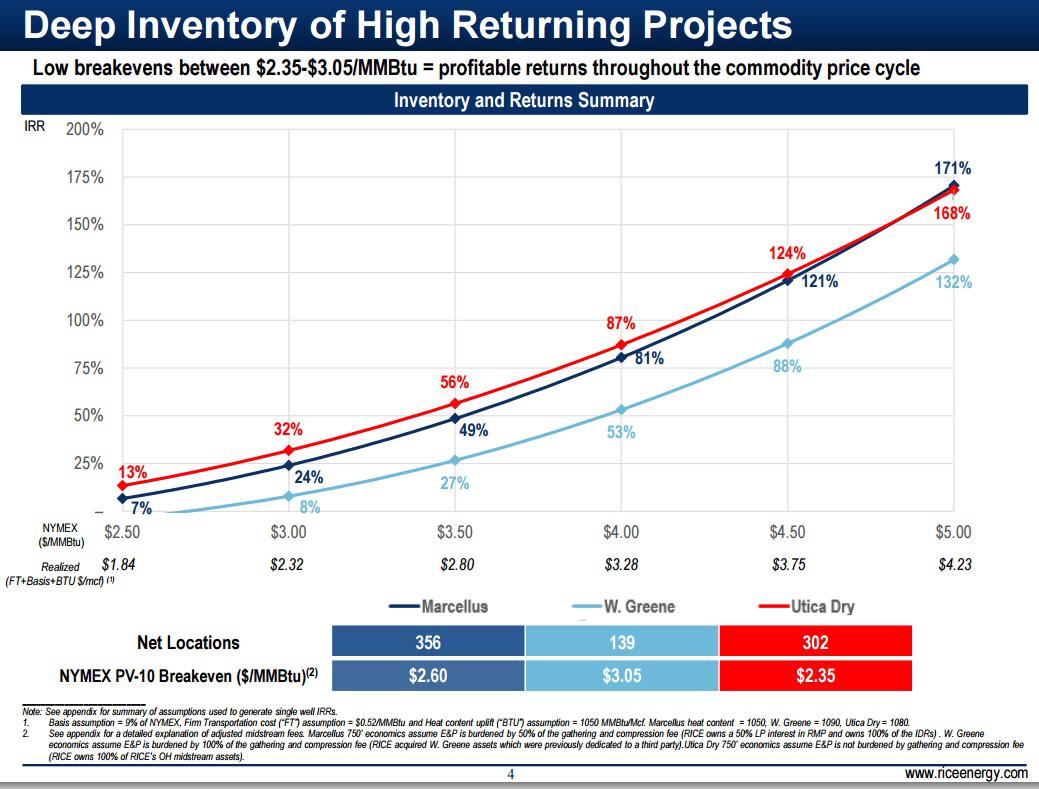
(Source: Rice Energy, June 2015)
Rice's peer operator in the Marcellus/Utica area Antero Resources (NYSE:AR) shows comparable returns at low gas prices. Antero expects to generate well-level IRRs on drilling in its highly-rich-gas and condensate acreage in the Marcellus in the 20%-30% range at a flat price of $3.00 per MMBtu.
(click to enlarge)
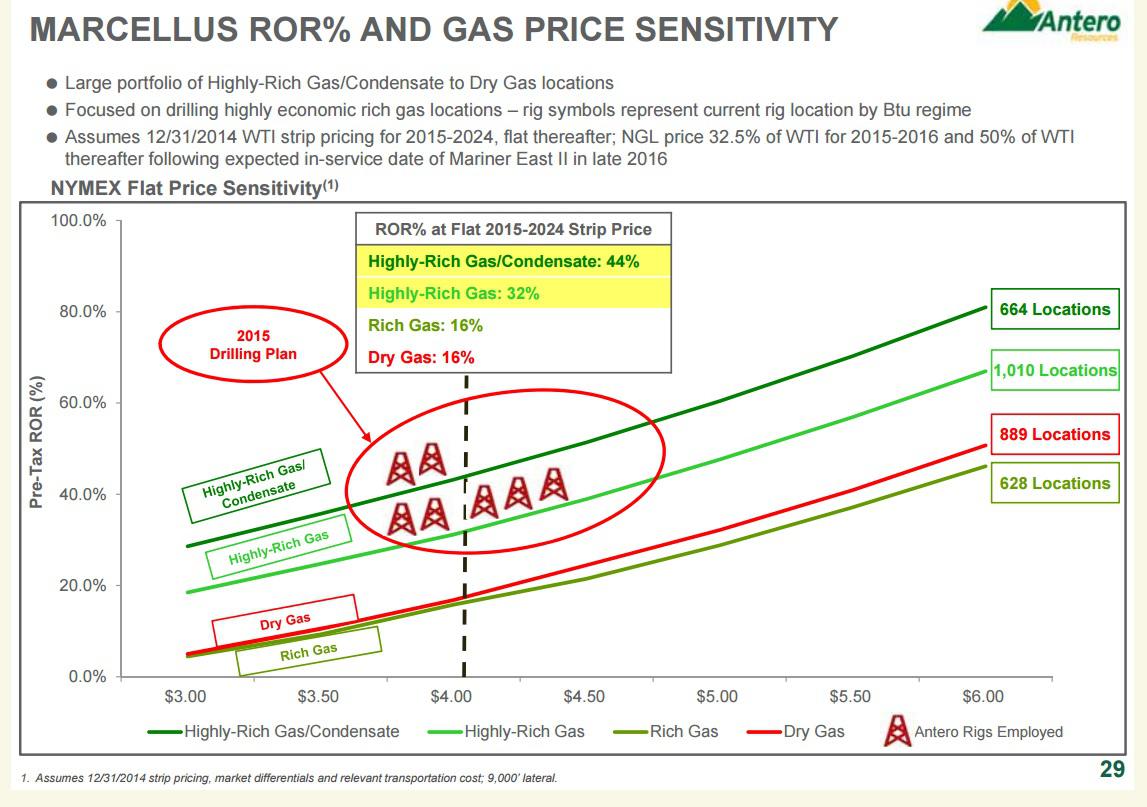
(Source: Antero Resources, June 2015)
Chesapeake Energy (NYSE:CHK) has indicated that its 2015 drilling program in the Marcellus North is generating threshold drilling returns of 30% at a realized price for natural gas as low as $1.50 per Mcf. Assuming that the differential to Nymex in the Marcellus North will decline to ~$1.00 per Mcf in the medium term, one would conclude that Chesapeake's drilling economics in the area should be compelling at Nymex prices above ~$2.60 per MMBtu (including the heat content factor).
(click to enlarge)
(Source: Chesapeake Energy, June 2015)
The Marcellus and Utica are not the only areas where operators are reporting competitive IRRs at relatively low natural gas prices. The Haynesville is an example of a Tier 2 shale where the transfer of technical lessons from oil shales is redefining drilling economics. The following slide shows return estimates by EXCO Resources (NYSE:XCO) for the company's drilling program in the play. As one can see, EXCO anticipates to generate returns in a 20% range at a flat Nymex price of $3.00 per MMBtu assuming the company can reduce its completed well costs by an additional 10%. Given that the estimate was prepared in March, such a cost improvement does not appear unrealistic in light of the industry's most recent service cost dynamics.
(click to enlarge)

(Source: EXCO Resources, March 2015)
In a similar fashion, Ultra Petroleum (NYSE:UPL), the leading operator in Pinedale Anticline, indicates that it can earn attractive returns at natural gas prices as low as $3.00 per Mcf at the wellhead (which in Ultra's case is comparable to the Nymex price per MMBtu).
(click to enlarge)
(Source: Ultra Petroleum, June 2015)
The above examples show quite clearly that $3.50 per MMBtu should not be ruled out as a potentially sustainable price for natural gas in the near-to-medium term, based on the industry's current cost structure.
Tailwinds And Challenges
There are two important factors that have substantially reduced the breakeven price for natural gas on the North American continent.- The first factor is the drop in oil prices. With oil shales and liquids-rich shales dominating North American drilling activity, the sharp curtailment in oil-directed investment has resulted in a dramatic reduction in supply chain costs for the natural gas industry. This factor alone has reduced completed well cost in some natural gas plays by 10%-15%, based on operator reports.
- The second factor is the "sunk" nature of infrastructure costs. Once the processing and takeaway capacity is put in place (including the LNG export facilities), a big portion of those cost categories become essentially "transparent" to the industry.
While the fixed component of the midstream cost will remain mostly sunk, the savings from supply chain price concessions are cyclical in nature and may disappear as industry-wide activity picks up.
In Conclusion…
The trend towards a lower cost of natural gas supply on the North American continent has been very powerful and may have not fully run its course.There are multiple components that define the cost of marginal supply. Some of those components are likely to continue on a secular decline trajectory, while certain others - such as supply chain costs - are cyclical in nature.
Demand growth from LNG exports, gas-fired power generation, Mexico exports and petrochemical uses have the ability of moving the market clearance point materially higher. However, the demand factor will come into play in earnest only in three-four years from now.
For the first time in a long time, the shape of the Henry Hub futures curve appears logical. On an inflation-adjusted basis, it implies a price of natural gas in the $3.25-$3.50/MMBtu range for the foreseeable future.
However, cost of supply is a dynamic metric. A strong recovery in oil prices combined with pent up demand have the ability to move the price of natural gas by as much as $1 per MMBtu higher.
The fundamentals discussed in this note may be relevant to natural gas-focused ETFs, such as:
- The United States Natural Gas ETF, LP (NYSEARCA:UNG)
- VelocityShares 3x Inverse Natural Gas ETN (NYSEARCA:DGAZ)
- VelocityShares 3x Long Natural Gas ETN (NYSEARCA:UGAZ)
- iPath DJ-UBS Natural Gas Total Return Sub-Index ETN (NYSEARCA:GAZ)
Source: http://seekingalpha.com/article/3262255-natural-gas-a-3_50-commodity
Comments
Post a Comment